Apply clang-tidy check modernize-use-emplace. This is slightly more efficient by using an inplace constructor and is the recommended style in parts of the codebase covered by clang-tidy. This just manually applies the check to rest of the codebase. Pinging @ezyang as this is related to my other PRs he reviewed like #89000

Pull Request resolved: https://github.com/pytorch/pytorch/pull/91077
Approved by: https://github.com/ezyang
This PR unifies and rationalizes some of the input representation in Result. The current approach of storing separate types in separate vectors is tedious for two types (Tensors and scalars), but would be even more annoying with the addition of TensorLists. A similar disconnection exists with sizes and strides which the user is also expected to zip with tensor_metadata.

I simplified things by moving inputs to a variant and moving sizes and strides into TensorMetadata. This also forced collection of sizes and strides in python tracer which helps to bring it in line with op profiling. Collection of TensorLists is fairly straightforward; `InputOutputEncoder` already has a spot for them (I actually collected them in the original TorchTidy prototype) so it was just a matter of plumbing things through.

Differential Revision: [D40734451](https://our.internmc.facebook.com/intern/diff/D40734451/)
Pull Request resolved: https://github.com/pytorch/pytorch/pull/87825
Approved by: https://github.com/slgong-fb, https://github.com/chaekit
A recurring problem with assigning Tensor IDs is that we want to preserve identity when storage changes but we don't observe TensorImpl destruction so identity assignment is not robust to the ABA problem with respect to TensorImpl*. ~TensorImpl is far too hot to instrument; even adding a call to a no-op function in a different compilation unit increases overhead by tens of percent. (OSS builds do not have any sort of LTO.)

Fortunately there is a solution. A PyTorch Tensor is a `c10::intrusive_ptr<c10::TensorImpl>`, which in turn holds a storage. (Which is a `c10::intrusive_ptr<c10::StorageImpl>`) `c10::intrusive_ptr` has a `c10::weak_intrusive_ptr` class for taking non-owning references to the underlying object. The implementation involves both a strong refcount and weak refcount in `c10::intrusive_ptr`. If the strong refcount of an intrusive_ptr goes to zero and there are no weak references then everything is deleted. However if there is a weak reference then the intrusive_ptr calls `release_resources()` but not delete.

This has the effect of freeing the underlying resources (ensuring that program semantics are unchanged) but leaves behind an empty shell of an `intrusive_ptr` that the `weak_intrusive_ptr`s use to check status. And herein lies the solution: as long as we hold a weak reference to a TensorImpl we will block deletion and prevent the `TensorImpl*` from being reused.

This PR uses a `c10::weak_intrusive_ptr<c10::TensorImpl>` to store the address of profiled TensorImpls and then converts it to a raw pointer (or rather, a `TensorImplAddress`) during post processing when we no longer care about blocking address reuse.

Differential Revision: [D40492848](https://our.internmc.facebook.com/intern/diff/D40492848/)
Pull Request resolved: https://github.com/pytorch/pytorch/pull/87244
Approved by: https://github.com/slgong-fb, https://github.com/albanD
While optimizer can store state however it likes, in practice most optimizer state corresponds to a particular parameter. (This is the case for all `torch.optim` optimizers.) Thus, it turns out to be ergonomic to collect using that structure. Note that this doesn't lock us into anything; we can always collect state with non Tensor keys if the use case arises.

One simplification that arises is that Module and Optimizer collection has very similar structure. So similar, in fact, that it is possible to use a common template for config. I also found that a lot of the `check_and_store` logic could be simplified and inlined by this joining of collected optimizer state.

Differential Revision: [D40210703](https://our.internmc.facebook.com/intern/diff/D40210703/)
Pull Request resolved: https://github.com/pytorch/pytorch/pull/86753
Approved by: https://github.com/slgong-fb, https://github.com/aaronenyeshi
Summary:
- catch .grad tensor info
- update data type and `check_and_store`, etc
- update unit test case

Test Plan: buck run mode/opt //caffe2/test:profiler

Reviewed By: chaekit

Differential Revision: D39711295

Pull Request resolved: https://github.com/pytorch/pytorch/pull/86355
Approved by: https://github.com/chaekit
Summary:
Wrong reference counting of Python Objects has made intermittent and corner-case-only segfault.
- before : increment once decrement in a loop.
- after: increment and decrement in different but consistent loops.

Test Plan: buck run mode/opt //caffe2/test:profiler

Differential Revision: D39902973

Pull Request resolved: https://github.com/pytorch/pytorch/pull/85847
Approved by: https://github.com/robieta, https://github.com/aaronenyeshi
`PythonTracer` holds a pointer to an owning `RecordQueue`, however that relationship is not enforced and it is possible to dangle that pointer if the ProfilerState owning the `RecordQueue` is destroyed without proper cleanup.

We currently use a singleton to enforce the requirement that only one python tracer is active at a time, however a better formulation is to simply enforce that with an atomic bool and manage object lifetime through composition. In this new architecture, `RecordQueue` explicitly holds a unique_ptr to the python tracer instance. That way if `~RecordQueue` is called it will call `~PythonTracer` which can then clean up any state. Overall it is just a simpler ownership model, and less prone to unexpected failures.

Differential Revision: [D38955616](https://our.internmc.facebook.com/intern/diff/D38955616/)
Pull Request resolved: https://github.com/pytorch/pytorch/pull/83964
Approved by: https://github.com/slgong-fb
The ownership model between `RecordQueue` and `PythonTracer` is brittle; if a profiler is popped without proper shutdown it can dangle a reference in `PythonTracer` which will segfault when dereferenced. The next PR will address this; to start we simply move the code into `torch/csrc/profiler/orchestration` to limit the sloc delta when making actual changes.

Differential Revision: [D38933962](https://our.internmc.facebook.com/intern/diff/D38933962/)

**NOTE FOR REVIEWERS**: This PR has internal Facebook specific changes or comments, please review them on [Phabricator](https://our.internmc.facebook.com/intern/diff/D38933962/)!
Pull Request resolved: https://github.com/pytorch/pytorch/pull/83895
Approved by: https://github.com/slgong-fb
Summary:
Record nn.Module's parameters for detaild memory profiling:
- extend 'module_' in value cache  & NNModuleInfo to save parameters
- python binding and unit test case

Test Plan: buck run mode/opt //caffe2/test:profiler -- -r test_nnmodule

Differential Revision: D38379717

Pull Request resolved: https://github.com/pytorch/pytorch/pull/83209
Approved by: https://github.com/robieta
There are a couple of bugs in the python tracer related to how we cache values. The first is that `ValueCache::store<CallType::PyModuleCall>` wrongly assumes that it will only be called from the profiling callback and calls `PyEval_GetFrame`, effectively violating the encapsulation of the cache by accessing global state. Secondly, we use `arg` to cache bound C functions. This turns out not to be correct, and collisions are resulting in incorrect traces.

In both cases, we can solve the problem by introducing a concept of ephemeral data which is used to materialize a cached value, but is not part of the cache key. (And the author is responsible for making sure that is done correctly.)

Differential Revision: [D38062921](https://our.internmc.facebook.com/intern/diff/D38062921/)
Pull Request resolved: https://github.com/pytorch/pytorch/pull/81958
Approved by: https://github.com/ngimel
Summary: Dubugged a segfault issue in Ondemand python tracing. Committing as a a separate diff from D37410204.

Test Plan:
- run a python test case with the following command for on-demand flow:
echo -e "PYTHON_STACK_TRACE=true" > /tmp/scott_kineto.conf && dyno gputrace --gputrace_duration 300ms --gpuconf /tmp/scott_kineto.conf

Reviewed By: chaekit

Differential Revision: D37662988

Pull Request resolved: https://github.com/pytorch/pytorch/pull/81061
Approved by: https://github.com/albanD
Pull Request resolved: https://github.com/pytorch/pytorch/pull/78164

This PR finishes moving over the python tracer to use the unified event type. Things that changed:

1) The hacky after-the-fact splicing of python events in profiler_kineto.cpp is gone and python events now simply fold into the rest. (Yay!!!) This is a major BE win.
2) Added `ExtraFields<EventType::PyCall>` and `ExtraFields<EventType::PyCCall>`
3) The enter events (time + TraceKey) are now handled by RecordQueue for performance.
4) Python tracing now uses TSC for lower overhead.

Simplifications in profiler_python WRT part 1:
1) Rather than ValueCache emitting an intermediate value_t that gets further converted, load methods can now directly emit ExtraFields<...>
2) The complicated replay in profiler_python.cpp is replaced with a much simpler (and safer) pass to just pair start and end times.
3) During post processing we can now use `CallTypeHelper::map` to automatically pull in all events instead of having to loop over each the entries for each type manually. This will make it simpler to add new types of Python event later.

Differential Revision: [D36515869](https://our.internmc.facebook.com/intern/diff/D36515869/)

Approved by: https://github.com/aaronenyeshi
Pull Request resolved: https://github.com/pytorch/pytorch/pull/78163

The python function tracer is complicated and separate from the other profile types, so I've chosen to break the change into two diff. The first (this one) reworks the cache structure to make it amenable to integration (as well as some other nice tweaks) and the next one actually moves it over.

The old cache scheme worked very hard to pack all the information about an event into a small struct via bit packing, with a couple secondary caches for things like names. Because of the space constraints on that struct (and the fact that it had to represent all call and return types) there were a lot of subtle invariants swirling around that made it hard to offload anything to a different component. The new cache system is more modular and also, as it turns out, a bit faster. (Benchmarks in part 2)

There is a more detailed description of the cache hierarchy in the PR, but the gist is that I use various specializations to handle the different event types (python call, nn module, c function) and lean on the type system to keep everything safe and organized. (One nice thing about using unique IDs is that they also implicitly encode the event type. They implicitly encode everything!) Given that we are going to want to expand the semantics (e.g. torch ops, DataLoader, etc) this will give a nice way to capture richer semantics without significantly increasing the complexity of the profiler.

Differential Revision: [D36379147](https://our.internmc.facebook.com/intern/diff/D36379147/)

Approved by: https://github.com/aaronenyeshi
Pull Request resolved: https://github.com/pytorch/pytorch/pull/77699

The current machinery to connect libtorch to libtorch_python for profiling is... meh. Adequite for separate components that mostly just need to send a trigger, but not really clean. This PR makes an abstract interface class that the python tracer subclasses so the profiler can actually get at the tracer singleton, albeit through a restricted interface. This will help fold Python tracing into the new unified event structure.

Differential Revision: [D36325739](https://our.internmc.facebook.com/intern/diff/D36325739/)

Approved by: https://github.com/aaronenyeshi
Summary:
Pull Request resolved: https://github.com/pytorch/pytorch/pull/70326

See D24145988 for context: it allows loops such as for(int i=0;i<10;i++) to be expressed as for(const auto i : c10::irange(10)). This is nice because it auto-types the loops and adds const-safety to the iteration variable.

Test Plan: buck run //caffe2/torch/fb/sparsenn:test

Reviewed By: r-barnes

Differential Revision: D33243400

fbshipit-source-id: b1f1b4163f4bf662031baea9e5268459b40c69a3
Summary:
There were two issues with the original PR:
1) My assumption that bound C functions could be trusted to stay alive was not valid. I'm still not entirely sure what was dying, but I've just added a cache so that the first time I see a function I collect the repr just like I was already doing with Python functions.

2) `std::regex` is known to be badly broken and prone to segfaults. Because I'm just doing a very simple prefix prune it's fine to do it manually; see `trimPrefix`. Long term we should move all of PyTorch to `re2` as the internal lint suggests, but CMake is hard and I couldn't get it to work.

Pull Request resolved: https://github.com/pytorch/pytorch/pull/68325

Reviewed By: chaekit

Differential Revision: D32432596

Pulled By: robieta

fbshipit-source-id: 06fb4bcdc6933a3e76f6021ca69dc77a467e4b2e
Summary:
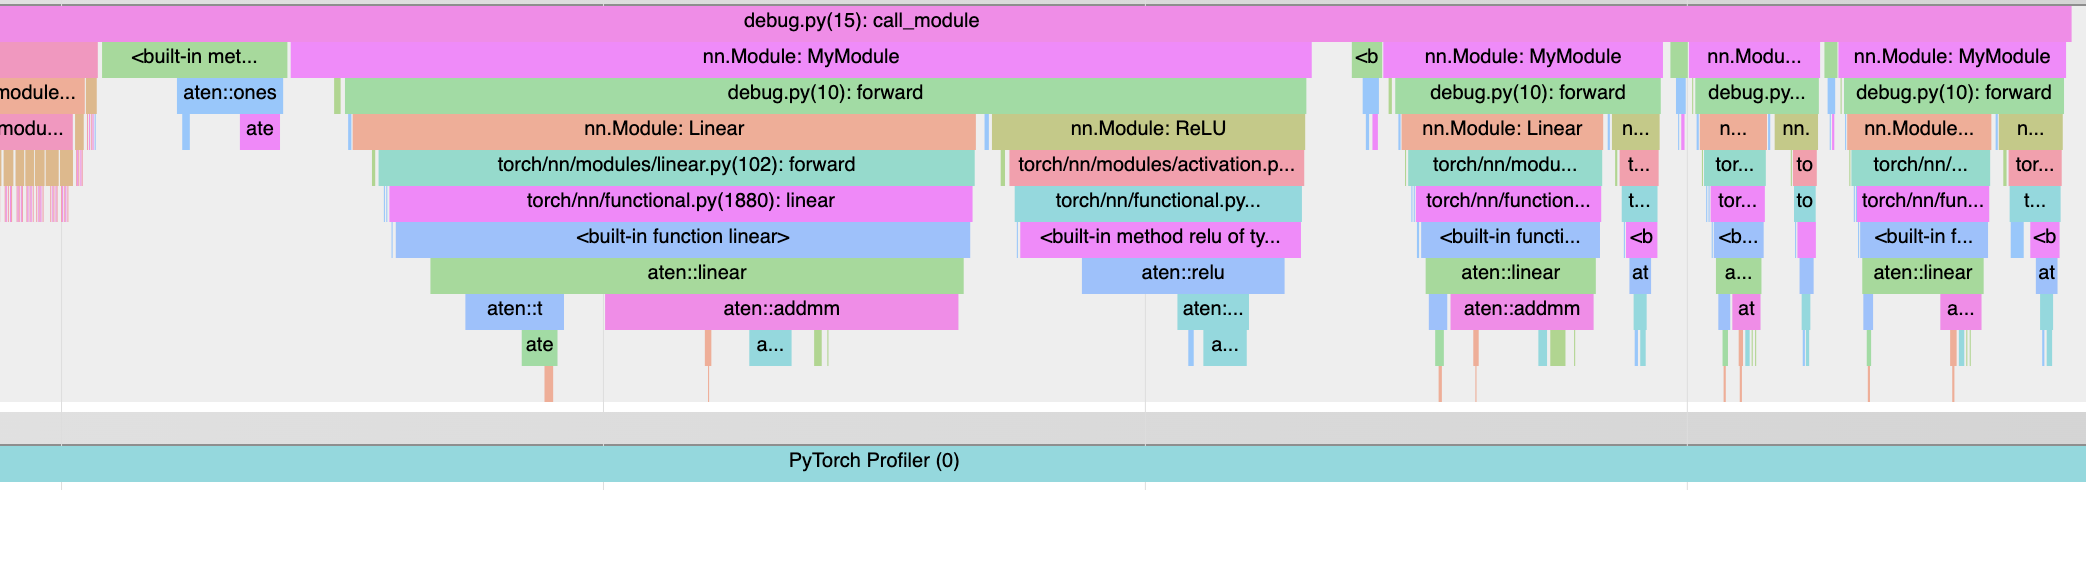
This PR instruments the CPython interpreter and integrates the resulting trace into the PyTorch profiler.
The python tracing logic works by enabling `PyEval_SetProfile`, and then logging the minimal information to track every time python calls or returns from a function. A great deal of care has gone into keeping this process very lightweight; the `RawEvent` struct is only two words and doesn't do anything fancy. When a python function is called, we have to do extra work. If the call is to `nn.Module.__call__`, we simply incref to extend the life of the module. Otherwise we check if we have seen the function before, and if not go through the (somewhat expensive) task of saving the strings which we then cache.
To actually get a useful timeline, we have to replay the events to determine the state of the python stack at any given point. A second round of stack replay is needed to figure out what the last python function was for each torch op so we can reconstruct the correct python stack. All of this is done during post processing, so while we want to be reasonably performant it is no longer imperative to shave every last bit.
I still need to do a bit of refinement (particularly where the tracer interfaces with the profiler), but this should give a good sense of the general structure.
Pull Request resolved: https://github.com/pytorch/pytorch/pull/67407
Test Plan:
```
import torch
class MyModule(torch.nn.Module):
def __init__(self):
super().__init__()
self.linear = torch.nn.Linear(2, 2)
self.relu = torch.nn.ReLU()
def forward(self, x):
x = self.linear(x)
return self.relu(x)
def call_module():
m = MyModule()
for _ in range(4):
m(torch.ones((2, 2)))
def top_level_fn():
with torch.profiler.profile(with_stack=True) as p:
call_module()
p.export_chrome_trace("test_trace.json")
top_level_fn()
```
<img width="1043" alt="Screen Shot 2021-10-27 at 6 43 18 PM" src="https://user-images.githubusercontent.com/13089297/139171803-f95e70f3-24aa-45e6-9d4b-6d437a3f108d.png">
PS: I've tried to comment liberally, particularly around some of the more magical parts. However I do plan on doing another linting and commenting pass. Hopefully it's not too bad right now.
Reviewed By: gdankel, chaekit
Differential Revision: D32178667
Pulled By: robieta
fbshipit-source-id: 118547104a7d887e830f17b94d3a29ee4f8c482f